Ratings and Rankings
Counting Points
While the graph gives a fair indication of how teams relate to each other based on the links that survive the trimming process, it doesn’t actually have any direct bearing on the creation of the rankings. Instead, a different strategy is used to determine each team’s rating. The three graphing methods use the same rating system which is very simple. The first step is to calculate how many points “out” points and how many “in” points each team has. A team’s out points represents how many paths there are with the team at the top. Having more out points will raise a team’s ranking. A team’s in points represents the paths where the team is at the bottom and the path leads in to the team.
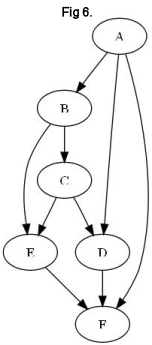
In the following example we will take 6 teams that have each played 3 games, with these results:
A→B
A→D
A→F
B→C
B→E
C→E
C→D
D→F
E→F
The graph to the right (Fig 6) represents this outcome, but with redundant arrows displayed for
clarity. To count a team's out points, start at the team and follow one of its BeatWins summing the
weight of the link to the total. From the team you end up at, select one of that team's BeatWins and
add its weight to the total as well. Continue down until you reach a team with no wins, then return
up one level and select an unselected BeatWin. Once you have traversed the entire graph using this
pattern, the sum of the weights is the "out score". For teams low on the graph, finding their out
paths is easy. F has 0 since it has no wins. E has 1 (E→F) and D has 1 (D→F). For C, start by adding
C→D (1) and then follow D→F (1). F has no wins, so you have to return to D. D has no other wins, so
return to C. Now follow C→E (1) and E→F (1). This covers all of the possible paths from C, and
finishes with a total of 4. There is however, an easier way to count these as you work your way up
the graph. Instead of following every path for every team, you only need to sum the already counted
paths of every team that the starting team has a direct BeatWin over, and then add the weights of the
links to them. For example, for C, instead of traversing the graph, we could add D's score (1) to E's
score (1) for 2, then add the weights of the links from C to D and E (1 each for 2 more, and 2 + 2 = 4).
Using this method we can find B by adding C (4) and E (1) and the links to them (2) to get 7. Then
for A sum B (7), D (1), and F (0) and add the links to them (3) for its total of 11. To verify this
method, here is the traversal path from A:
A→F (+1, total=1, go back to A)
A→D (+1, total=2)
A→D→F (+1, total=3, go back to A)
A→B (+1, total=4)
A→B→E (+1, total=5)
A→B→E→F (+1, total=6, go back to B)
A→B→C (+1, total=7)
A→B→C→E (+1, total=8)
A→B→C→E→F (+1, total=9, go back to C)
A→B→C→D (+1, total=10)
A→B→C→D→F (+1, total=11, all paths covered)
The same strategy works in reverse to figure out the in paths. Starting from the top A has 0 paths in, B has 1, C has 2, D has 4, E has 5, and F has 12. Now that we have each team’s paths in and out, we can determine the rankings for each team by subtracting their paths in from their paths out which leaves them with their raw path score.
Scaling the Scores
While creating the raw rating score is all that is necessary to properly order all of the teams, it would be nice if the scores themselves gave us more valuable information. As a season progresses, the shape of the graph can fluctuate as more links are added, and sometimes removed through BeatLoops. This causes huge shifts of the range of the raw scores, making it difficult to compare any given week with another. In order to make it so a week can be put in perspective with another, the scores are put through a formula which places the score on a scale from -10 to 10 where 0 represents a team with exactly as many in paths as out paths. In theory, a 10 would represent a team that has exactly 1 BeatWin to every other team and no BeatLosses. However, since this is impossible in football, the formula stretches the scale to allow for scores to pass 9 in rare circumstances.
In the end, a high rating score can represent a couple of things. Since a team must be rated higher than any team it has defeated, it could simply mean that they defeated a single team with a high score. A truly good team however, will have defeated several teams higher on the chart. Having more BeatWins high on the chart adds stability to the position on the graph, and in turn causes more branches in BeatPaths and a higher rating in the end.
The final pieces to be taken into consideration are how many other teams are high on the charts. If there are two or more teams with the same raw score at the top of the chart, they will each share a lower scaled rating than if a single team occupied the top spot. This means that the higher the scaled rating represents dominance. Lastly, the best team in the league is put in perspective with the worst team in the league. If the worst team in the league has more paths in than the best team has out, it means the top team doesn’t own enough of the graph and as a result it drags the higher teams down some. All of the things taken into consideration for the top teams are also put in reverse to scale those at the bottom.